What Healthcare Receivables Financing Is, What It Isn't, and Whether It Makes Sense for Your Practice
Written by Emily Davis
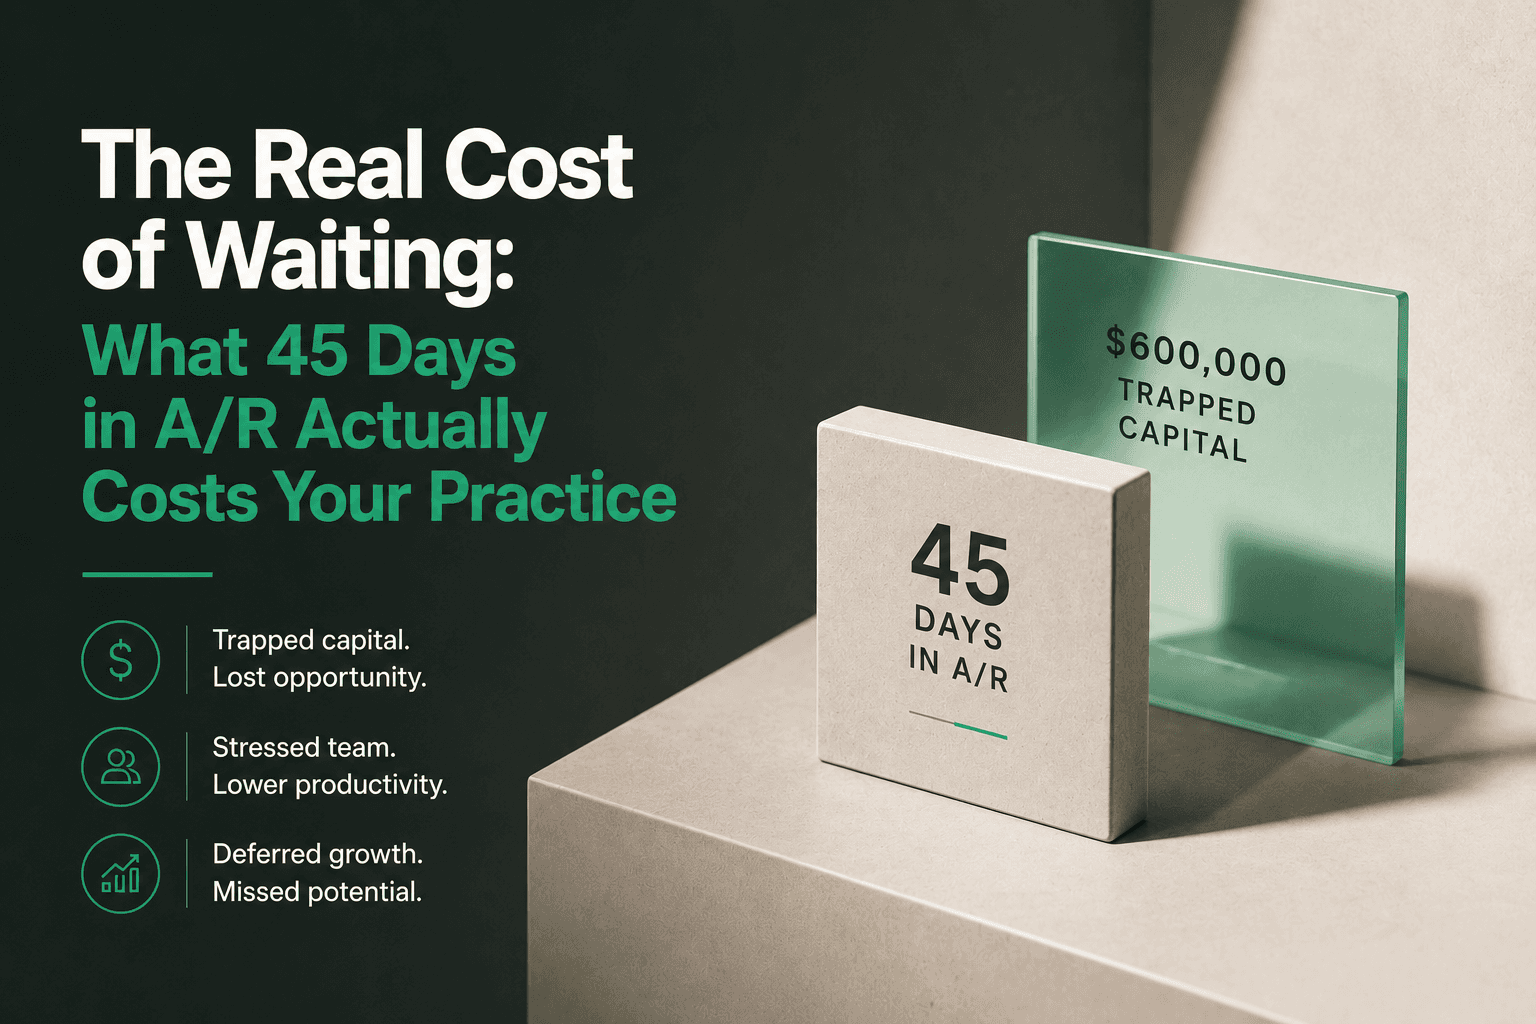
The Real Cost of Waiting: What 45 Days in A/R Actually Costs Your Practice
Everyone in healthcare knows the payer delay is bad. Few practices have calculated exactly how bad.
This post runs the numbers on a typical independent medical practice. Not a theoretical exercise. Real dollars, real opportunity costs, real stress. The goal is to give practice owners and administrators a clear framework for evaluating what 45 days in accounts receivable actually means for their bottom line, their growth, and their team.
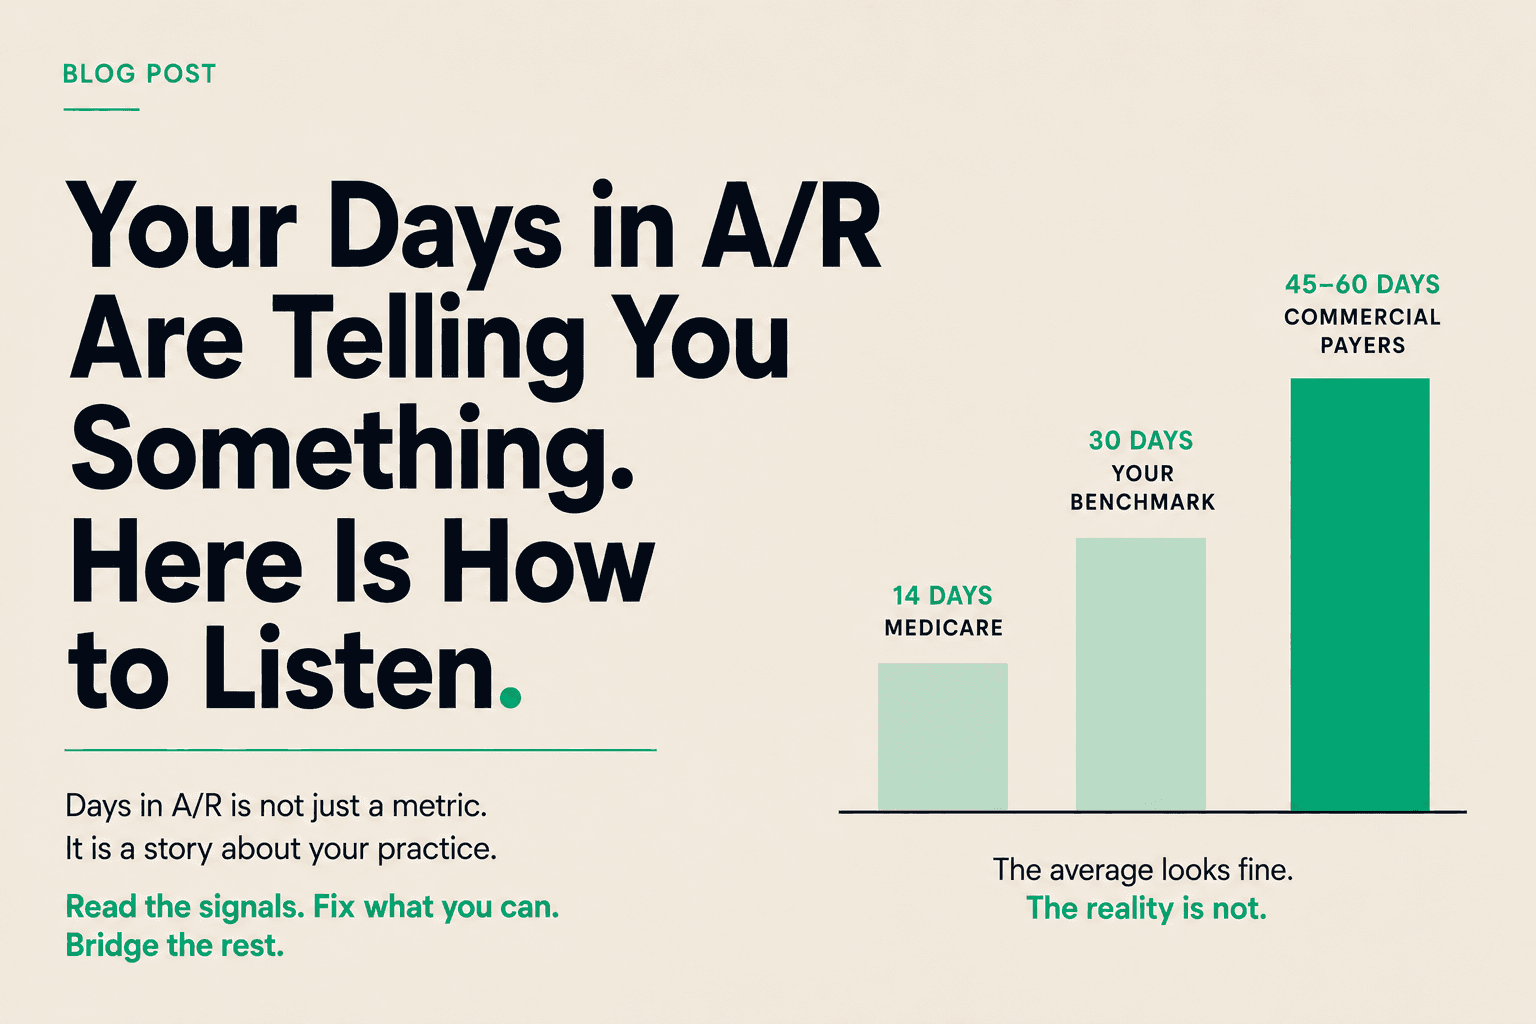
The Baseline: A Typical Independent Practice
Let's define our example practice:
- Monthly insurance claim volume: $400,000
- Average days in A/R: 45 days
- Staff: 12 employees (clinical + administrative)
- Monthly payroll: $85,000
- Monthly rent and overhead: $18,000
- Monthly supply and equipment costs: $12,000
This is a mid-sized independent practice. Not a hospital system. Not a single-provider shop. The kind of practice that represents the backbone of American healthcare delivery.
At $400,000 monthly claim volume with a 45-day collection cycle, this practice has approximately $600,000 in outstanding A/R at any given time. That is six hundred thousand dollars of earned revenue that the practice cannot access.
Now let's look at what that costs.
Cost 1: The Opportunity Cost of Trapped Capital
The most obvious cost is the simplest to calculate. If your practice had access to that $600,000 today, what could you do with it?
Scenario A: Growth investment
A second location, a new service line, or an additional provider costs money upfront. If your capital is locked in A/R, you defer growth until the cash becomes available. In a competitive market, six months of delay can mean a competitor captures the patient population you were targeting.
Even if you do not have a specific growth project in mind, the opportunity cost of idle capital is real. At a conservative 8% annual return (the kind of return you might expect from equipment investment, marketing, or even a simple business line of credit deployed strategically), $600,000 of trapped capital costs you:
$600,000 x 8% / 12 months = $4,000 per month in lost opportunity.
That is $48,000 per year in growth you did not capture because your money was stuck in someone else's process.
Scenario B: Operating leverage
Many suppliers offer 2/10 net 30 terms. Pay in 10 days, get 2% off. On $12,000 monthly supply spend, that is $240 per month in savings. If you are waiting 45 days to collect from payers, you are almost certainly not capturing early-pay discounts. That is another $2,880 per year left on the table.
Scenario C: Marketing and patient acquisition
Digital marketing for medical practices typically requires consistent spend to maintain patient volume. A $5,000 monthly marketing budget, paused for two months because cash is tight, can create a patient volume dip that takes six months to recover. The cost is not just the paused spend. It is the lost patients, the lost procedures, and the lost lifetime value.
Conservatively, the total opportunity cost of $600,000 in trapped A/R is $4,000-$8,000 per month. Call it $60,000-$100,000 per year.
Cost 2: The Stress Cost on Your Team
This one is harder to quantify but impossible to ignore.
When A/R stretches to 45 days, your practice manager starts making weekly calls to check claim status. Your biller works overtime to follow up on denials. Your front desk gets pressured to collect more at the point of service, which strains patient relationships.
The stress compounds. Staff turnover in billing and administration is already high in healthcare. Burnout from chasing payments is a major contributor.
Replacing a medical biller costs roughly $5,000 in recruitment and training. Replacing a practice manager costs $15,000-$25,000. If delayed A/R contributes to one additional staff departure per year, that is a real cost.
But the bigger cost is the mental load on the people who stay. When your team is constantly worried about cash flow, they are not optimizing operations. They are firefighting. That mental tax shows up in slower processes, more errors, and less capacity for improvement.
Assigning a dollar value to stress is imperfect. But if we estimate the productivity loss from a distracted, anxious administrative team at 10% of their salary cost, that is:
$85,000 monthly payroll x 40% administrative share x 10% productivity loss = $3,400 per month.
That is another $40,000 per year.
Cost 3: The Growth Cost of Deferred Decisions
The most expensive cost of delayed A/R is the cost of decisions not made.
When cash flow is unpredictable, practice owners become conservative. They defer hiring the nurse practitioner who would allow them to see 20% more patients. They delay the EHR upgrade that would reduce documentation time. They pass on the real estate opportunity for a second location because they cannot commit to the lease deposit.
Each deferred decision has a compounding effect. The nurse practitioner not hired in January means 200 fewer patient visits by December. The EHR upgrade delayed by six months means six more months of inefficiency. The second location passed on means a competitor opens there instead.
This is the hidden tax of slow A/R. It does not show up on a spreadsheet as a line item. It shows up two years later as a practice that should have grown 25% but only grew 8%.
If we estimate the value of one major deferred decision per year at $100,000 in lost growth (a conservative figure for a practice doing $4.8M annually), the growth cost is substantial.
Adding It Up
Let's consolidate:
| Cost Category | Monthly Estimate | Annual Estimate |
|---------------|------------------|-----------------|
| Opportunity cost (trapped capital) | $4,000-$8,000 | $60,000-$100,000 |
| Stress cost (productivity, turnover) | $3,000-$4,000 | $40,000-$50,000 |
| Growth cost (deferred decisions) | $8,000+ | $100,000+ |
| Total | $15,000-$20,000 | $200,000+ |
For a practice doing $4.8M in annual insurance revenue, $200,000 in hidden costs from 45-day A/R represents more than 4% of total revenue. That is not a finance charge. That is a structural leak.
The Alternative
Healthcare receivables financing changes the math.
When you advance against submitted insurance claims, you compress 45 days into 1 day. Your $600,000 in A/R becomes working capital you can deploy immediately.
The fee for that advance is typically a small percentage of the claim value. Compare that to the $200,000 annual cost of waiting, and the math is not close.
More importantly, the non-financial benefits are immediate. Your practice manager stops sweating payroll. Your biller focuses on accuracy instead of follow-up calls. You make growth decisions from a position of strength instead of scarcity.
The Bottom Line
45 days in A/R is not an accounting detail. It is a strategic liability.
The costs are real. They are measurable. And they are compounding every month you wait.
The practices that win are not the ones with the best payer contracts. They are the ones with the fastest access to their own revenue.
Stop leaving $200,000 on the table. Start treating your A/R like the asset it is.